Many companies get lost with data and for good reason. First, there are thousands of metrics a company can track and only a few of them actually matter, despite what vendors with outside interests may believe. For companies trying to get a grasp of their data setup, the Customer List is the gateway into beginning to understand their current data landscape. Through reviewing key variables from past efforts, we create a baseline for our upcoming activity.
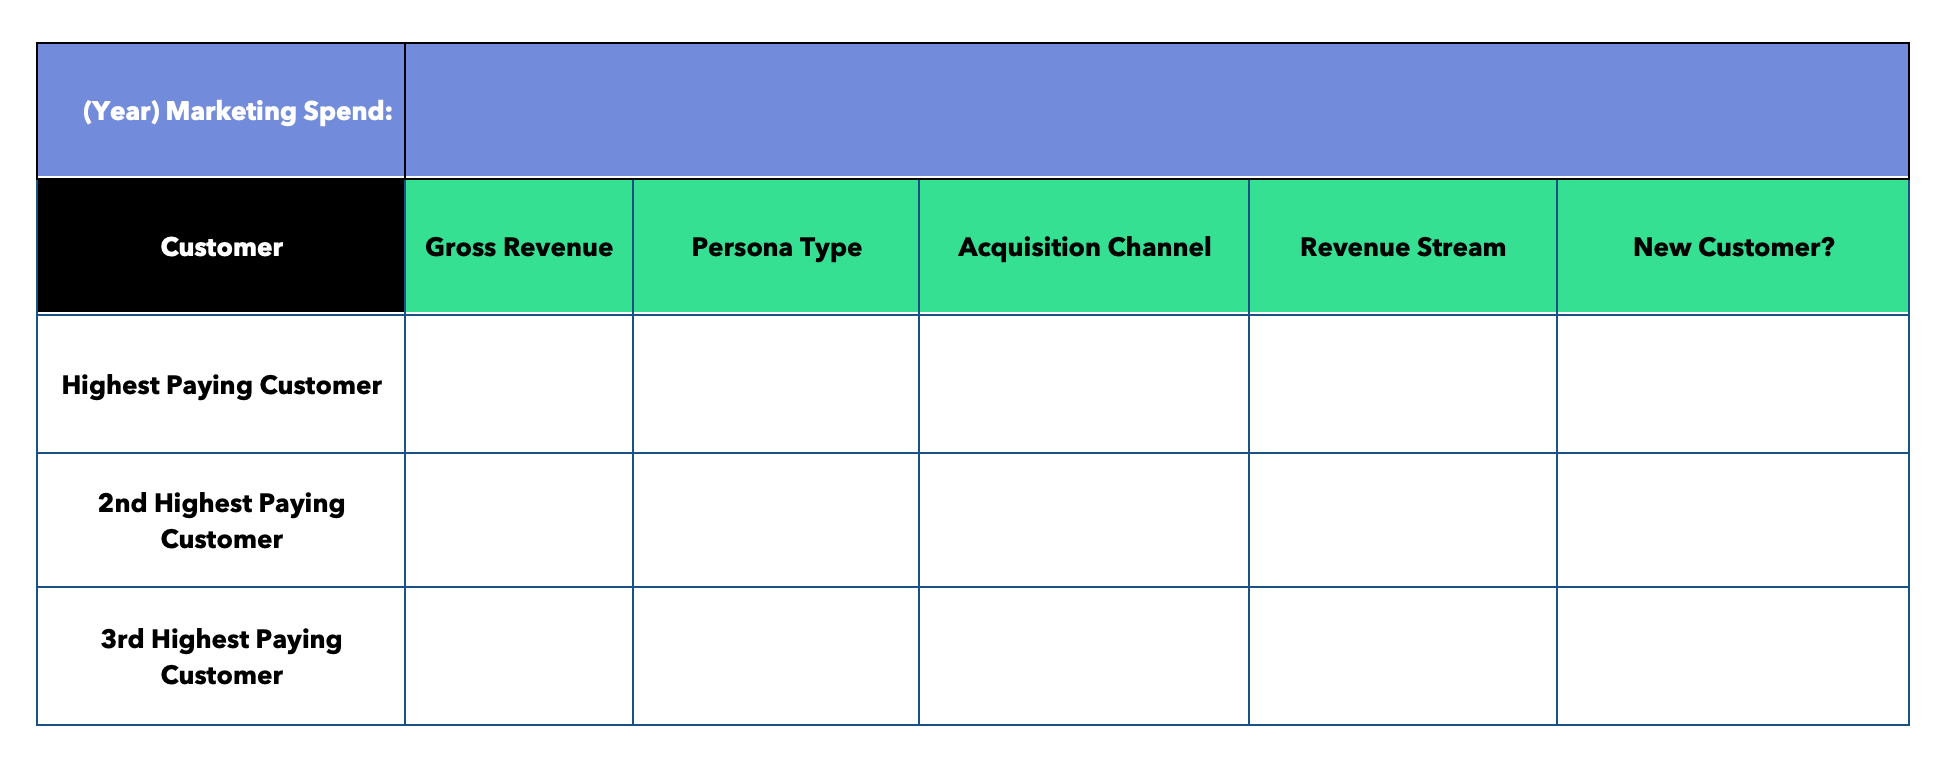
Step One: Build the List
The list is easy-to-build, but depending on the number of customers you have, it can be a little tedious. To begin, go to QuickBooks or your bookkeeping software. Export your paying customers from the past 12 months and sort from the highest revenue generator to the lowest.
Add a row above and create the following headings:
- Column A – Customer Name
- Sort by the highest paying customer
- Column B – Gross Revenue
- The amount each customer has paid the past twelve months
- Column C – Persona Type
- Not all customers may apply to this. Only put the label on customers you would consider “ideal” if they were not already.
- Column D – Acquisition Channel
- Where did the customer come from?
- Column E – Revenue Streams
- Which stream did they pay you for? Only identify one stream per customer, and if there are more than one, choose which one they paid the most for.
- Column F – New Customer?
- Identify if this customer was a first-time customer within the 12-month period of the export.
Thanks to the bookkeeping export, you should have columns A and B already filled out. Before going in and filling out the rest, add a row at the very top of the document. In Column A, type in “Marketing Spend”. Merge Columns B-F into one. Type in your marketing spend from the last 12 months. If this is not something you’re currently tracking, listing a ballpark figure is alright, but make sure you include EVERYTHING – human capital, systems, events, advertising dollars, etc.
Your sheet should look like the example below:
Now go through and fill out each column for every customer.
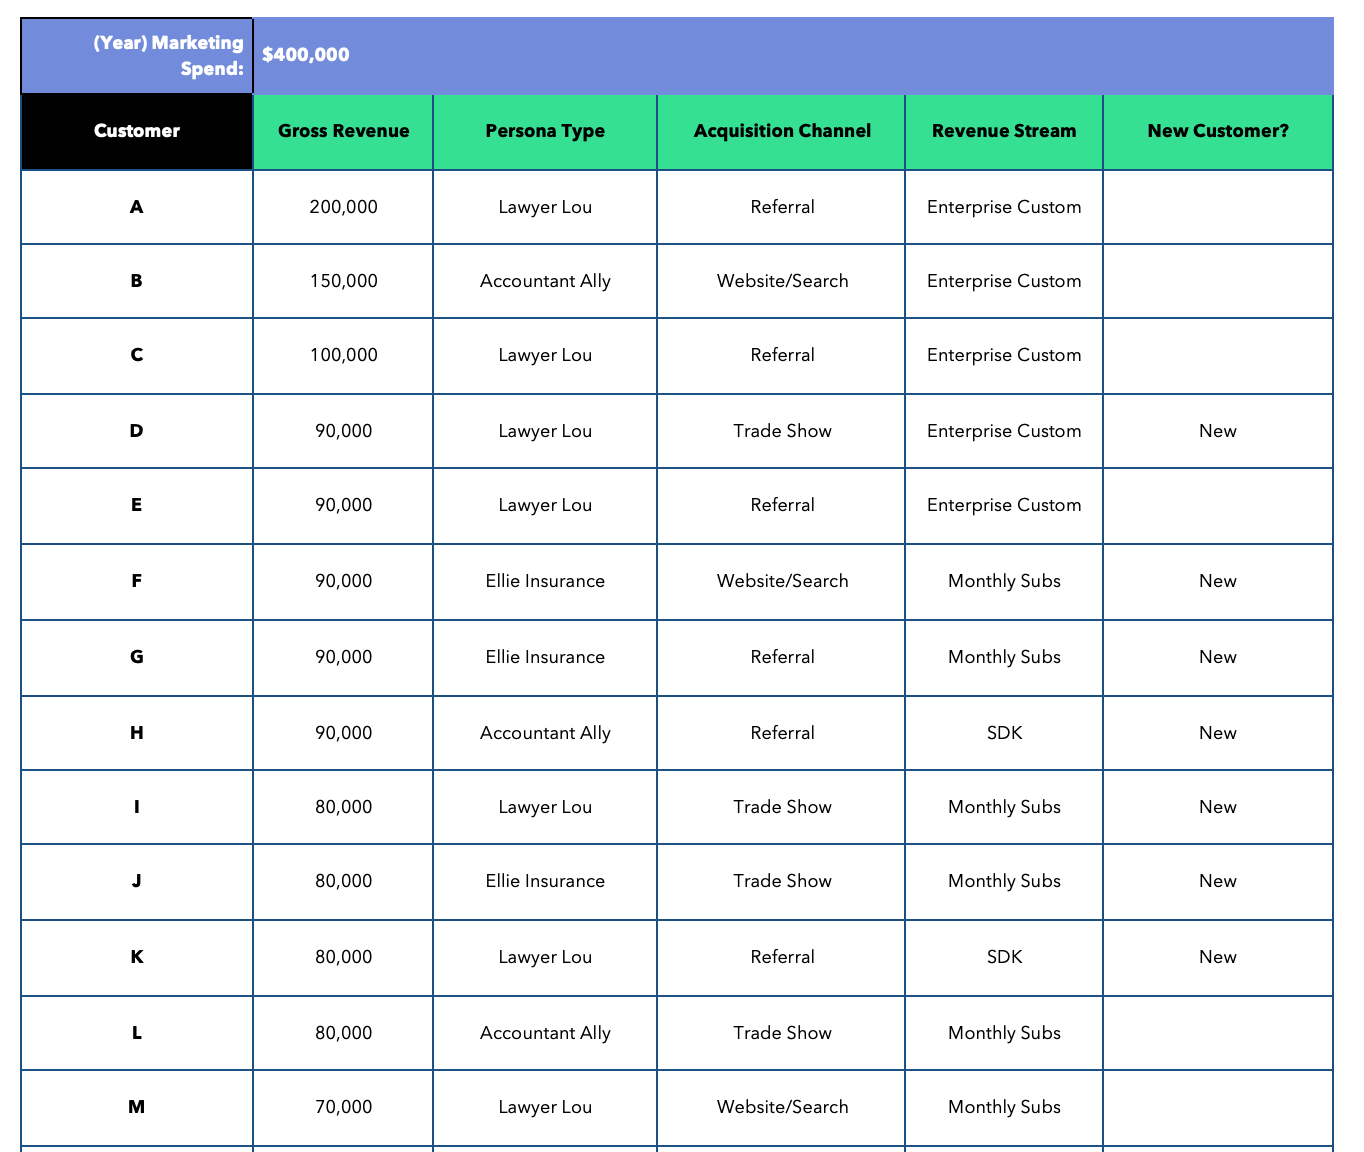
Note that if you want to work with a PMM implementor or an outside consultant, but you do not want to advertise your customer list to this person (or go through the NDA process with them), you can simply copy and paste column A from the example below and rename each customer “A,” “B,” and so forth. Who they are will not matter during the data exercises ahead, and the implementor does not need to know the actual company name to help you complete the work.
Before we move to step two, let’s use an example to help us illustrate what we’re trying to do. A young software company, we’ll call them “Young Software”, works with professional service companies to streamline their project management, invoicing, and customer service.
We will fill out their Customer List based on the following criteria of Young Software:
12 Month Marketing Spend: $400,000
Customers – 26, which we will name each letter of the alphabet
Gross Revenue – $2 million
Target Personas:
- Accountant Ally
- Lawyer Lou
- Ellie Insurance
Acquisition Channels:
- Referrals
- Direct Mail Campaigns
- Website/Search
- Trade Shows
- Cold Calling
Revenue Streams:
- Monthly subscriptions
- Software Development Kits
- Enterprise Custom Solution
Here’s what their hypothetical customer list looks like:
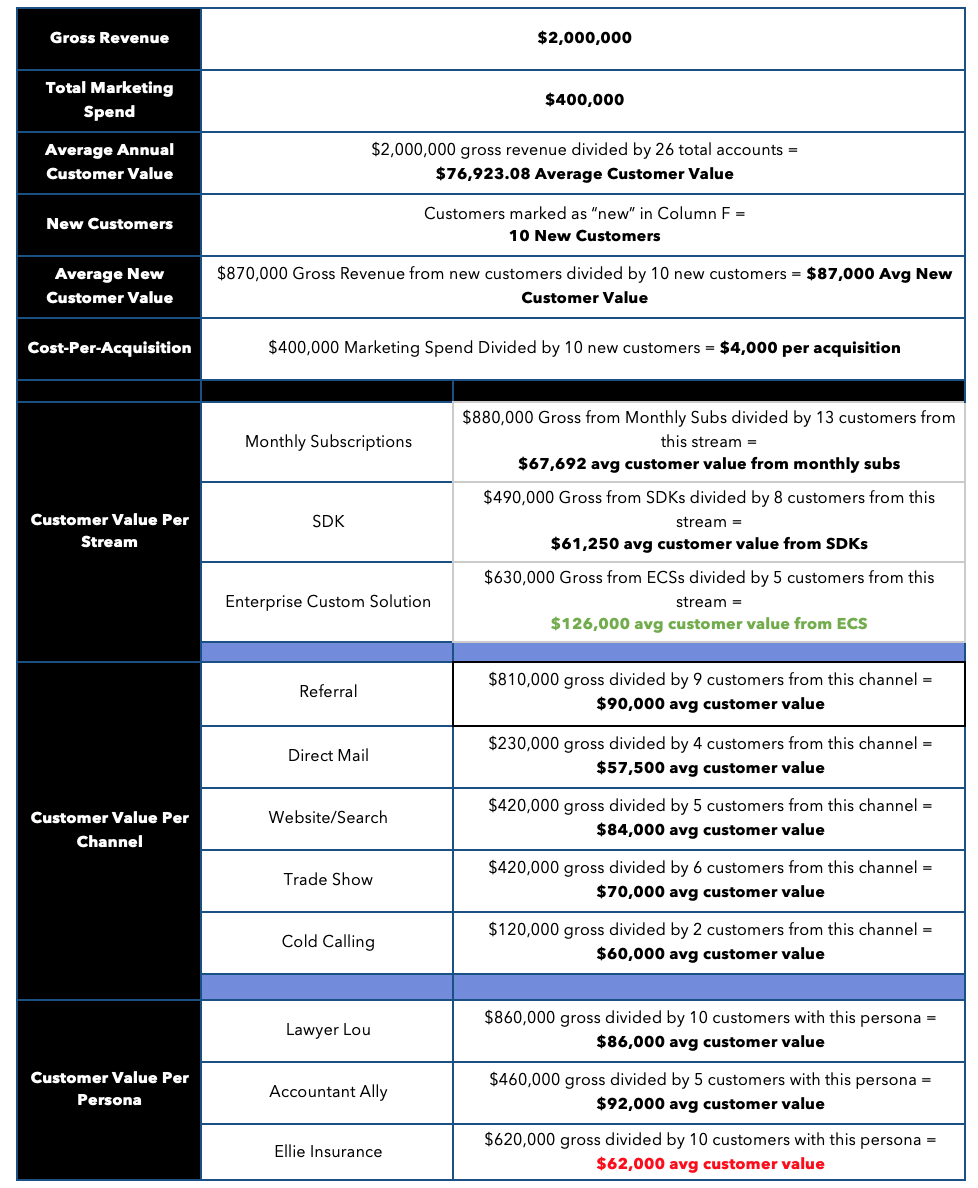
Step Two: The Calculations
Alright, we’ve done the tedious part – we got all of the information into the right places. Now comes the fun part – putting these numbers together and learning what they mean.
Here’s the list of calculations we’re looking to fill in:
- Gross Revenue
- Annual Value of a Customer***
- New Customers
- Average New Customer Value
- Cost-Per-Acquisition
- Customer Value Per Revenue Stream
- Customer Value Per Acquisition Channel
- Customer Value Per Persona
***Note: A more popular metric among marketers is the “Lifetime Value of a Customer.” However, this is one of the easiest pieces of data to manipulate, so we strip it down to something more concrete, the annual value.
Here’s how we calculate each:
- Gross Revenue
- Sum of all customers’ revenue
- Average Customer Value
- Gross Revenue divided by the number of total customers
- New Customers
- Sum of all customers marked as “new”
- Average New Customer Value
- New customer total divided by the gross revenue from all new accounts
- Cost-Per-Acquisition
- Total Marketing Spend divided by new customers
- Customer Value Per Revenue Stream
- For each stream, take the sum of each account that came from that stream and divide it by the total amount of accounts within the stream.
- Customer Value Per Acquisition Channel
- For each channel, take the sum of each account that came from that channel and divide it by the total amount of accounts from that channel.
- Customer Value Per Persona
- For each persona, take the sum of each account that you identify as that persona and divide it by the total amount of accounts listed as each persona.
Using “Young Software” as our example, below is what we’ve calculated for their company. Notice we highlight in green where we see a positive outlier and in red where we see a negative outlier:
Step Three: What are we Looking For with These Calculations?
When going through the Customer List, you’re identifying the starting point for your upward trajectory. You want more clients, at higher price points and to get them, you need to understand where you are today.
One of the most impactful elements of the exercise is identifying outliers. Outliers can be good, and when they are, we highlight them in green. When they are bad, we go with red.
Looking back at Young Software, we see that they have one revenue stream that significantly brings in larger accounts, their Enterprise Custom Solutions. Yet, ECS accounts are only about 20% of their total amount of customers. What’s happening within the company between the numbers? How much money is being spent on getting these types of customers versus the monthly subscriptions? How many people does it take to staff one of these accounts? Is the profit margin higher for ECS accounts as well? Knowing these accounts are significantly higher in value, how will we take this to our upcoming marketing efforts?
On the flip side, we recognize that we have a Persona, Ellie Insurance, that makes up almost half of the clientele and yet, is about a 20% lower account size on average than the other personas. Why is this? How is this impacted by the marketplace? Are there just more insurance agents that need the software than lawyers?
The answers to these questions can only come from getting everyone together to look at what the numbers are. When you go through the entire customer list and put labels on your current clientele based on the work you put in during Brand Day, you’re gathering intelligence on how you will move forward once you draw out your Marketing-to-Sales Maps. You see how your current Revenue Streams stack up, where you’re having success acquiring customers, and which Personas carry the most value to you. You start seeing numbers that you never considered before.
Conclusion
You’ve calculated the important numbers. You know the variables specific to your business. Now close this exercise by discussing the 7 questions below. Answer in no more than 2 sentences for each question and take no more than 30 minutes to complete. Put the answers away somewhere you can access them because they’re going to come in handy later in the Method.
1. We are spending $________ to acquire one customer. Knowing this, are we spending this $_________ the most effective way?
2. What do we think would be more effective – spending more money on marketing or throwing out the things that are not working and lowering our cost-per-acquisition?
3. How can we increase our Annual Value of a Customer?
4. Based on the data we have reviewed, what do we need to consider regarding our revenue streams?
5. Based on the data we have reviewed, what do we need to consider regarding our acquisition channels?
6. Based on the data we have reviewed, what do we need to consider regarding our personas?
7. Given our business, what other columns could be added to this sheet that may help us better understand our customers?


