Table of Contents
- 1.The 90-Day Framework: What You’re Actually Validating
- 2.Day 30: Data Integrity and Foundation Reports
- 3.Day 60: Pipeline Health and Adoption Dashboards
- 4.Day 75: Marketing Attribution and Revenue Signals
- 5.Day 90: Forecasting and Full-Funnel Visibility
- 6.What It Means When the Reports Aren’t There
- 7.The 90-Day HubSpot Audit Checklist
- 8.Your CRM Should Work for You, Not the Other Way Around
- 9.FAQs
If you just rolled out HubSpot and you’re waiting to see results, that’s the first problem.
The first 90 days after a CRM implementation aren’t a grace period. They’re a validation window. This is when you find out whether the system was built to reflect how your business actually sells, or just built to look like it was.
A lot of revenue leaders get handed a clean portal, a few default dashboards, and a “good luck” from their onboarding team. They don’t know what to look at, what the numbers should say, or what it means when something’s missing. By the time they realize the system isn’t working, months of bad data have already compounded into a forecasting problem.
This post lays out exactly which reports, dashboards, and leading indicators you should be pulling within 90 days of a HubSpot rollout, and what it means if they aren’t there.
The 90-Day Framework: What You’re Actually Validating
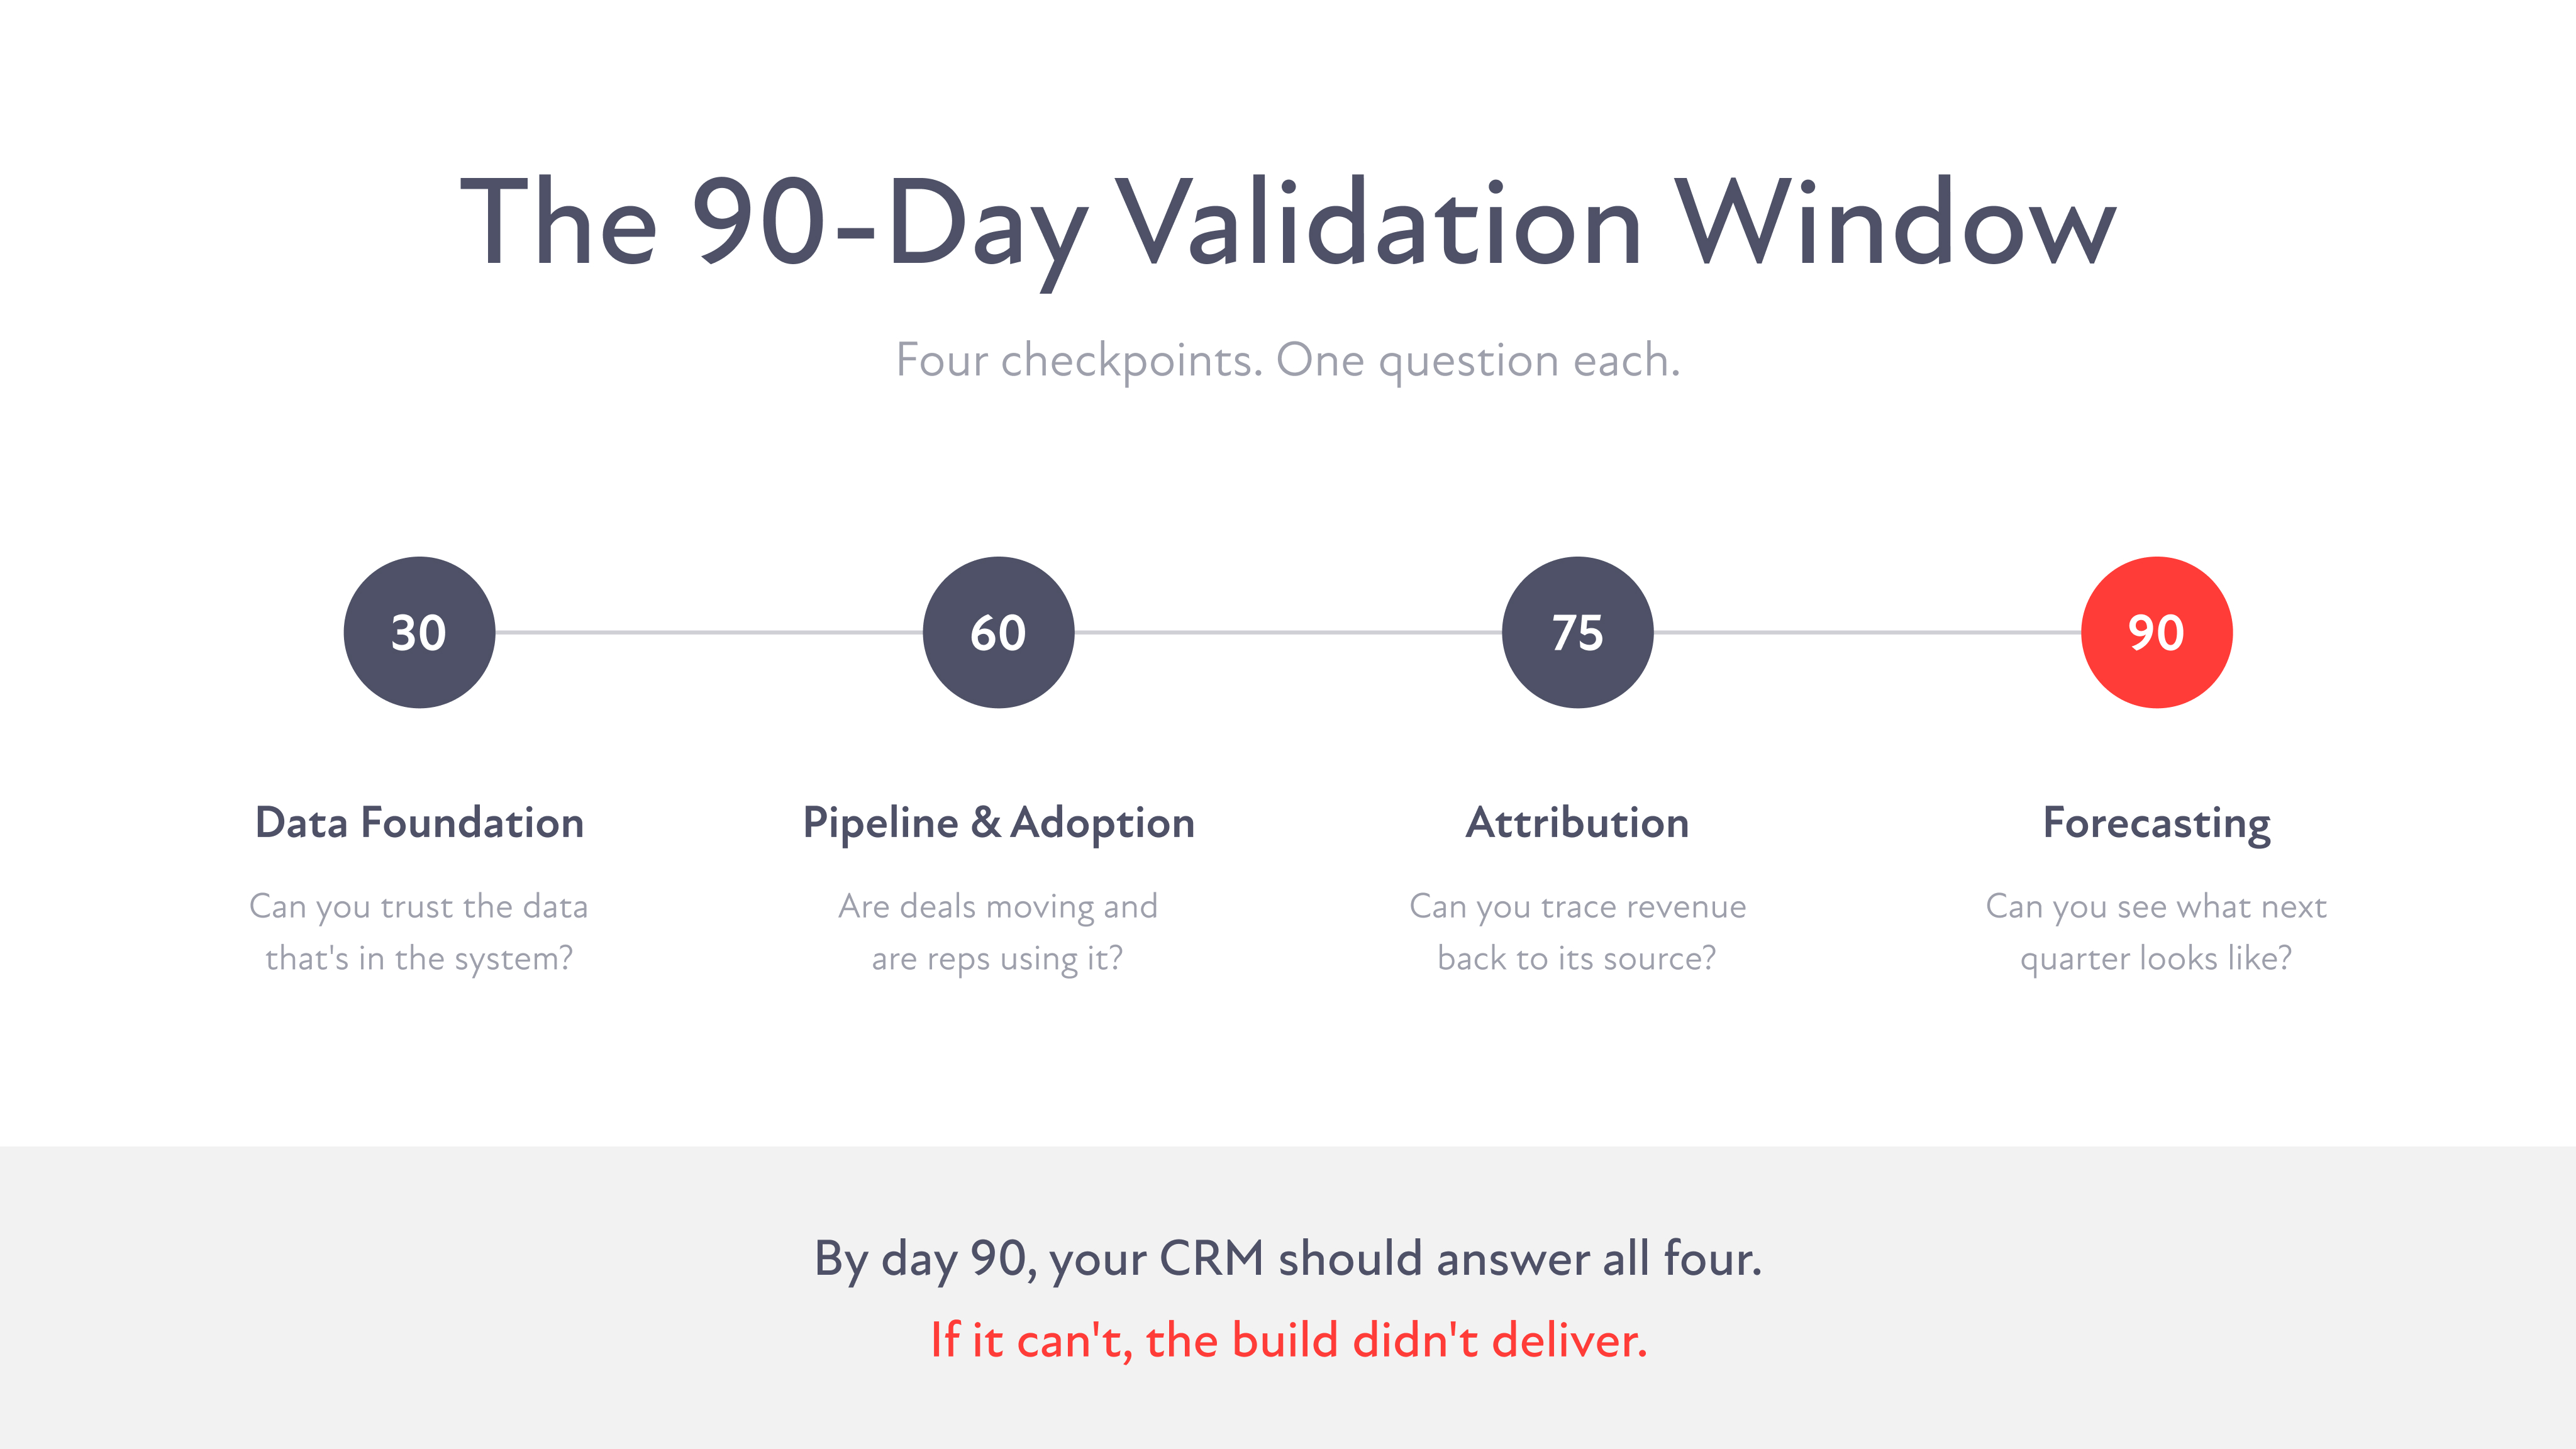
Before you look at a single report, you need to understand what the 90-day window is actually measuring.
You’re not just checking whether HubSpot is “up and running.” You’re validating three things:
- Data trustworthiness. Can you rely on what’s in the system to make decisions?
- Operational adoption. Are your teams actually using the CRM the way it was designed?
- Revenue signal clarity. Can you connect marketing activity, sales activity, and pipeline outcomes to business results?
If you’re missing any of those three, you don’t have a functioning revenue engine. You have an expensive contact database.
Day 30: Data Integrity and Foundation Reports
Why This Comes First
Every insight your CRM will ever give you depends on the quality of what’s inside it. If records are incomplete, duplicated, or improperly associated, every downstream report is compromised. Day 30 is about confirming your foundation is solid before you build anything on top of it.
The Reports to Pull
Duplicate Contact and Company Report
HubSpot’s built-in duplicate management tool surfaces records with matching email addresses, phone numbers, or company domains. Pull this report and look at your duplicate rate. Target: under 2%. If you’re sitting at 10% or higher, your data migration wasn’t cleaned properly before import.
Required Field Completion Report
Build a custom report in HubSpot’s Report Builder filtering contacts and companies by completion rate on your required fields: lifecycle stage, lead source, industry, company size, and deal owner. Target: over 85% completion on every required field. Gaps here mean your forms, imports, or integrations aren’t capturing what they should.
Contact-to-Company Association Report
Pull a report showing what percentage of your contacts are properly associated to a company record. In B2B, an unassociated contact is an incomplete record. If more than 15% of your contacts have no company association, your data structure has a problem.
Data Source Breakdown
HubSpot tracks the original source of every record. Build a report showing your contact and deal volume broken down by source: organic search, paid, direct, offline, imports, integrations. This is the baseline you’ll compare against in month three to see what’s actually driving pipeline.
What It Means If These Aren’t There
If you can’t pull these reports cleanly, one of two things happened: the data architecture wasn’t designed to capture this information during setup, or your migration brought in dirty data that was never cleaned. Both require going back to the foundation, not just tweaking properties.
Day 60: Pipeline Health and Adoption Dashboards
Why This Is the Inflection Point
By day 60, your reps have been in the system long enough to reveal whether they’re actually using it. And your pipeline has had enough time to show you whether deals are moving or just sitting. This is where a lot of implementations quietly start to fail.
The Reports to Pull
Deal Velocity Report
HubSpot’s deal reports let you track average time spent in each pipeline stage. Build this report and look at your stage-by-stage averages. If deals are sitting in “Proposal Sent” for 45 days on average, that’s a process problem, not just a data problem. Your pipeline stages may not reflect how deals actually progress.
Stage-to-Stage Conversion Rate Report
This shows you what percentage of deals move from each stage to the next. If you’re seeing a 70% drop-off between “Discovery Call Booked” and “Proposal Sent,” something is breaking in that transition. This report turns your pipeline from a number into a story.
Stalled Deal Report
Filter your open deals by last activity date. Any deal with no logged activity in 21+ days should be flagged. Build this as a saved view your sales managers check weekly. Stalled deals erode forecast accuracy and hide problems that need coaching conversations.
User Activity Adoption Dashboard
HubSpot’s built-in Sales Analytics includes a rep activity report showing calls logged, emails sent, meetings booked, and tasks completed by user. Build a dashboard that shows this broken down by individual rep. This isn’t about micromanaging. It’s about identifying who’s using the system and who’s routing around it.
Weekly Active Users vs. Licensed Seats
Pull a simple report comparing your licensed HubSpot seats to weekly login activity. If 60% of your licenses are dormant two months after go-live, you have an adoption problem that will not fix itself.
What It Means If These Aren’t There
Low adoption and murky pipeline data almost always trace back to one of two root causes: the CRM wasn’t configured to match how your team actually works, or reps don’t see enough value in logging activity to make it a habit. The first is a design flaw. The second is a change management gap. Both needed to be addressed before go-live, but they can still be fixed now.
Day 75: Marketing Attribution and Revenue Signals
Why This Is the Question Every CMO Should Be Asking
If you can’t trace a closed deal back to the campaign or channel that started it, your marketing budget is flying blind. Attribution isn’t a nice-to-have for mature companies. It’s a requirement for anyone who needs to justify spend, optimize channels, or prove that marketing is actually contributing to revenue.
The Reports to Pull
First-Touch and Multi-Touch Attribution Report
HubSpot’s Attribution Reports (available in Marketing Hub Professional and above) show you which touchpoints influenced a contact’s path to becoming a deal or customer. Pull both first-touch and multi-touch views. First-touch tells you what’s generating awareness. Multi-touch tells you what’s actually closing pipeline.
Lead Source Breakdown in Closed/Won Deals
Filter your closed/won deals by original source. If more than 30% of your closed revenue shows “direct traffic” or “unknown” as the source, your UTM structure is broken or your ad platforms aren’t synced properly. That’s not a reporting problem. That’s a tracking infrastructure problem.
Campaign Influence Report
HubSpot allows you to associate contacts and deals to specific campaigns. Build a report showing influenced revenue and influenced deal count by campaign. This is how you make the case for budget. Not impressions, not MQLs. Influenced pipeline.
Cost-Per-SQL by Channel
This requires connecting your ad spend data to HubSpot. If you’re using HubSpot’s Ads tool or integrating via a third-party connector, you can build a report showing cost-per-contact by source, filtered down to contacts that progressed to SQL status. This is the metric that actually matters. Not cost-per-lead. Cost-per-qualified-lead.
What It Means If These Aren’t There
Missing attribution almost always means one of three things: UTM parameters weren’t standardized before launch, campaigns weren’t being associated to contacts in HubSpot, or ad platform integrations weren’t set up correctly. None of these are unfixable, but every week you wait, you’re accumulating attribution debt that gets harder to unwind.
Day 90: Forecasting and Full-Funnel Visibility
Why Day 90 Is the Real Test
Ninety days in, your CRM should be able to answer the questions your CEO is asking. What does next quarter look like? Where are deals getting stuck? Is marketing contributing to pipeline in a measurable way? If you can’t answer these questions from your HubSpot dashboards, your implementation didn’t deliver what it should have.
The Reports to Pull
Forecast Report by Rep and by Stage
HubSpot’s Forecast tool lets you build weighted pipeline projections based on deal stage probability. Pull a forecast view broken down by rep and by stage. By day 90, your stage probabilities should have been calibrated to your actual historical close rates, not the HubSpot defaults. If you’re still running on default probabilities, your forecast is a guess, not a projection.
Full-Funnel Conversion Report
Build a report that shows your contact-to-lead-to-MQL-to-SQL-to-opportunity-to-close conversion rates across the full funnel. This is the report that tells you where the real friction is. If you’re generating high MQL volume but your SQL conversion is low, that’s a qualification or handoff problem. If your opportunity-to-close rate is strong but your pipeline is thin, that’s a top-of-funnel problem. You can’t solve what you can’t see.
Revenue by Source Dashboard
Combine your closed/won deal data with lead source and campaign data to build a revenue-by-source dashboard. This is the single most important view for a revenue leader because it directly answers: what is generating money for this business? It should be on your screen every Monday morning.
Sales and Marketing Alignment Dashboard
Build a combined dashboard that shows MQL volume, SQL conversion rate, deal creation rate, and pipeline value side by side. This is the view that gets marketing and sales in the same conversation. When both teams are looking at the same numbers, the blame game stops.
Time-to-Close Trend Report
Pull average days-to-close over the last 90 days and compare it to any historical data you have from before the HubSpot rollout. If your time-to-close is getting longer post-implementation, something in your process got more complicated, not less. That needs to be investigated immediately.
What It Means If These Aren’t There
If you can’t build a reliable forecast 90 days into your HubSpot rollout, the implementation was either architecturally incomplete or your pipeline stage definitions and deal properties weren’t set up with forecasting in mind. This is one of the most common gaps we see in generic implementations. Forecasting requires intentional design, not just a CRM going live.
What It Means When the Reports Aren’t There
If you’ve hit day 90 and your HubSpot portal can’t answer the questions above, there are three likely root causes.
Your implementation was built generically. A lot of HubSpot onboarding follows a standard template that gets the system live quickly but doesn’t reflect how your business actually sells, markets, or tracks success. Generic setups produce generic insights, which is to say, no insights at all.
Your data foundation wasn’t prioritized. Dirty data coming into HubSpot produces dirty reports coming out. If your historical records weren’t cleaned and properly mapped during migration, every report you run is built on a compromised foundation.
Your teams weren’t aligned before go-live. If sales and marketing weren’t aligned on stage definitions, lead qualification criteria, and handoff processes before the system launched, HubSpot will faithfully reflect that misalignment in every dashboard you build.
All three are fixable. But they require more than adjusting a few report filters. They require going back to the architecture and rebuilding with intent.
The 90-Day HubSpot Audit Checklist
Day 30: Data Foundation
- Duplicate contact and company rate is under 2%
- Required field completion rate is over 85%
- Contacts are properly associated to company records
- Data source tracking is live and capturing correctly
- All integrations are syncing without errors
Day 60: Pipeline and Adoption
- Deal velocity report is built and benchmarked
- Stage-to-stage conversion rates are visible
- Stalled deal view is set up and being reviewed weekly
- Rep activity adoption dashboard is live
- Weekly active users are at or above 80% of licensed seats
Day 75: Attribution
- First-touch and multi-touch attribution reports are running
- Lead source is populated on over 70% of closed/won deals
- Campaign influence reporting is active
- Cost-per-SQL is calculable by channel
- UTM structure is standardized across all paid and organic channels
Day 90: Forecasting and Full-Funnel Visibility
- Forecast report is built with calibrated stage probabilities
- Full-funnel conversion report shows drop-off by stage
- Revenue-by-source dashboard is live
- Sales and marketing alignment dashboard exists and is being reviewed together
- Time-to-close trend is being tracked and compared to pre-implementation baseline
Your CRM Should Work for You, Not the Other Way Around
If you’re 90 days into your HubSpot rollout and you still can’t answer basic questions about where your pipeline is coming from, how fast deals are moving, or whether marketing is contributing to revenue, the implementation didn’t deliver.
That’s not a technology problem. HubSpot is an exceptionally powerful platform when it’s configured correctly. The problem is almost always in how it was designed, what data went in, and whether the teams using it were built into the architecture from the start.
A CRM built for your business tells you things. It tells you where deals stall, which channels drive qualified pipeline, and what next quarter looks like before you’re already in it.
If yours isn’t doing that, let’s fix it.
Ready to get real answers from your CRM? Talk to our team.
FAQs


