AKA How to Measure ROI in Account-Based Marketing Without Wasting Everyone’s Time
Account-based marketing (ABM) isn’t cheap. You’re personalizing outreach, coordinating sales and marketing, building multi-threaded plays and running all of that for a limited number of accounts. So if you’re not measuring the right metrics, you’re wasting budget, bandwidth, and buy-in.
This guide will help you:
- Cut through the fluff to focus on ABM metrics that drive actual pipeline and revenue
- Understand how to measure ROI in account-based marketing with precision
- Learn what account-based marketing benchmarks you should be tracking using realistic, practical ABM KPIs
Let’s get into it.
What Does ABM ROI Mean?
Here’s a simple ROI breakdown:
(Revenue from ABM accounts − Total ABM spend) ÷ ABM spend = ROI
But ABM isn’t like regular marketing, because you’re not tracking leads, you’re tracking accounts.
To do it right, you need to measure how those accounts move through your funnel, from target to customer, and how your team helps make that happen.
What’s a “Good” Account-Based Marketing ROI?
Here’s a basic example:
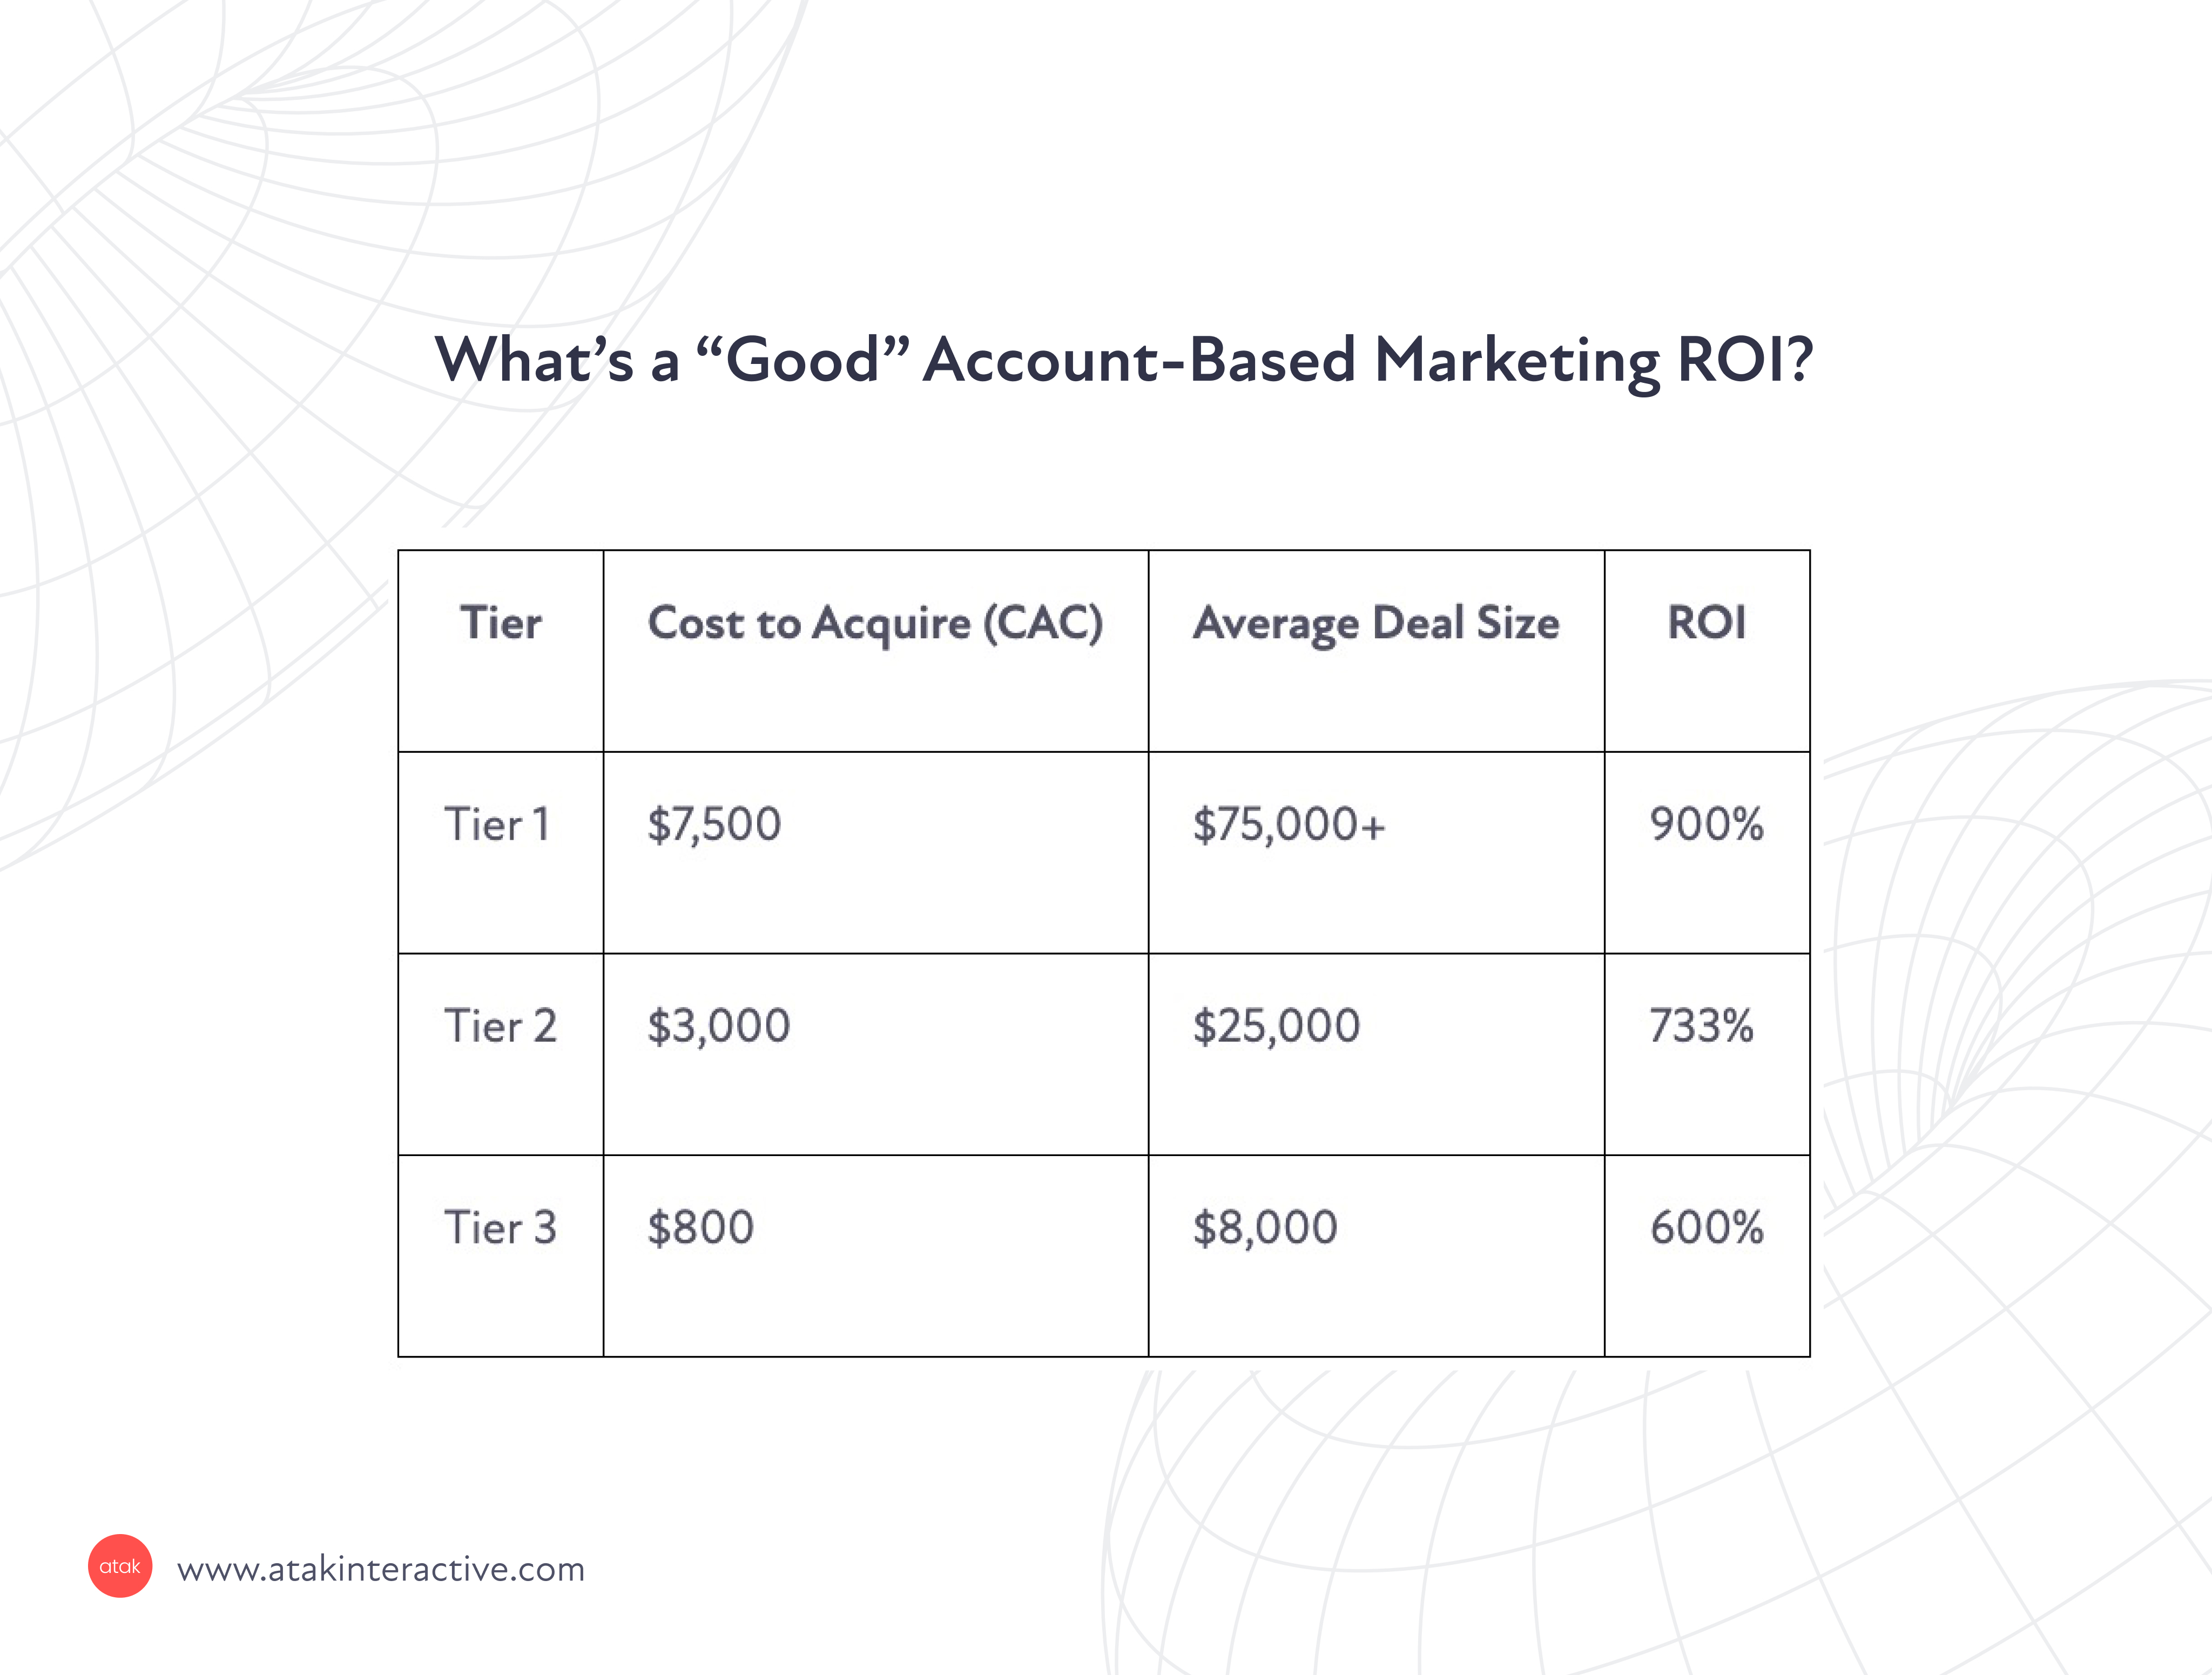
Not all accounts pay off the same way. That’s why you focus your best efforts on Tier 1.
Now, what should you be measuring?
The ABM Metrics Mini-Guide: What to Track (and Why)
ABM metrics fall into three categories: Engagement, Journey / Pipeline, and Attribution / Revenue.
Here’s a curated list (with explanations) of the ABM metrics your team should track.
Engagement Metrics — Are target accounts paying attention?
These tell you whether your outreach is resonating before deals exist.
1. Account Engagement Score
Create a composite score per account based on clicks, site visits, content downloads, event attendance, email interactions, etc. This gives you a “heat level” per account.
Track the following KPIs:
- Website visits (unique visits per account)
- High-intent pageviews (pricing, demo, use cases)
- Email opens + clicks
- Content downloads
- Event registrations or attendance
- Retargeting ad clicks
- LinkedIn or paid social engagement
Then calculate it (example scoring model):
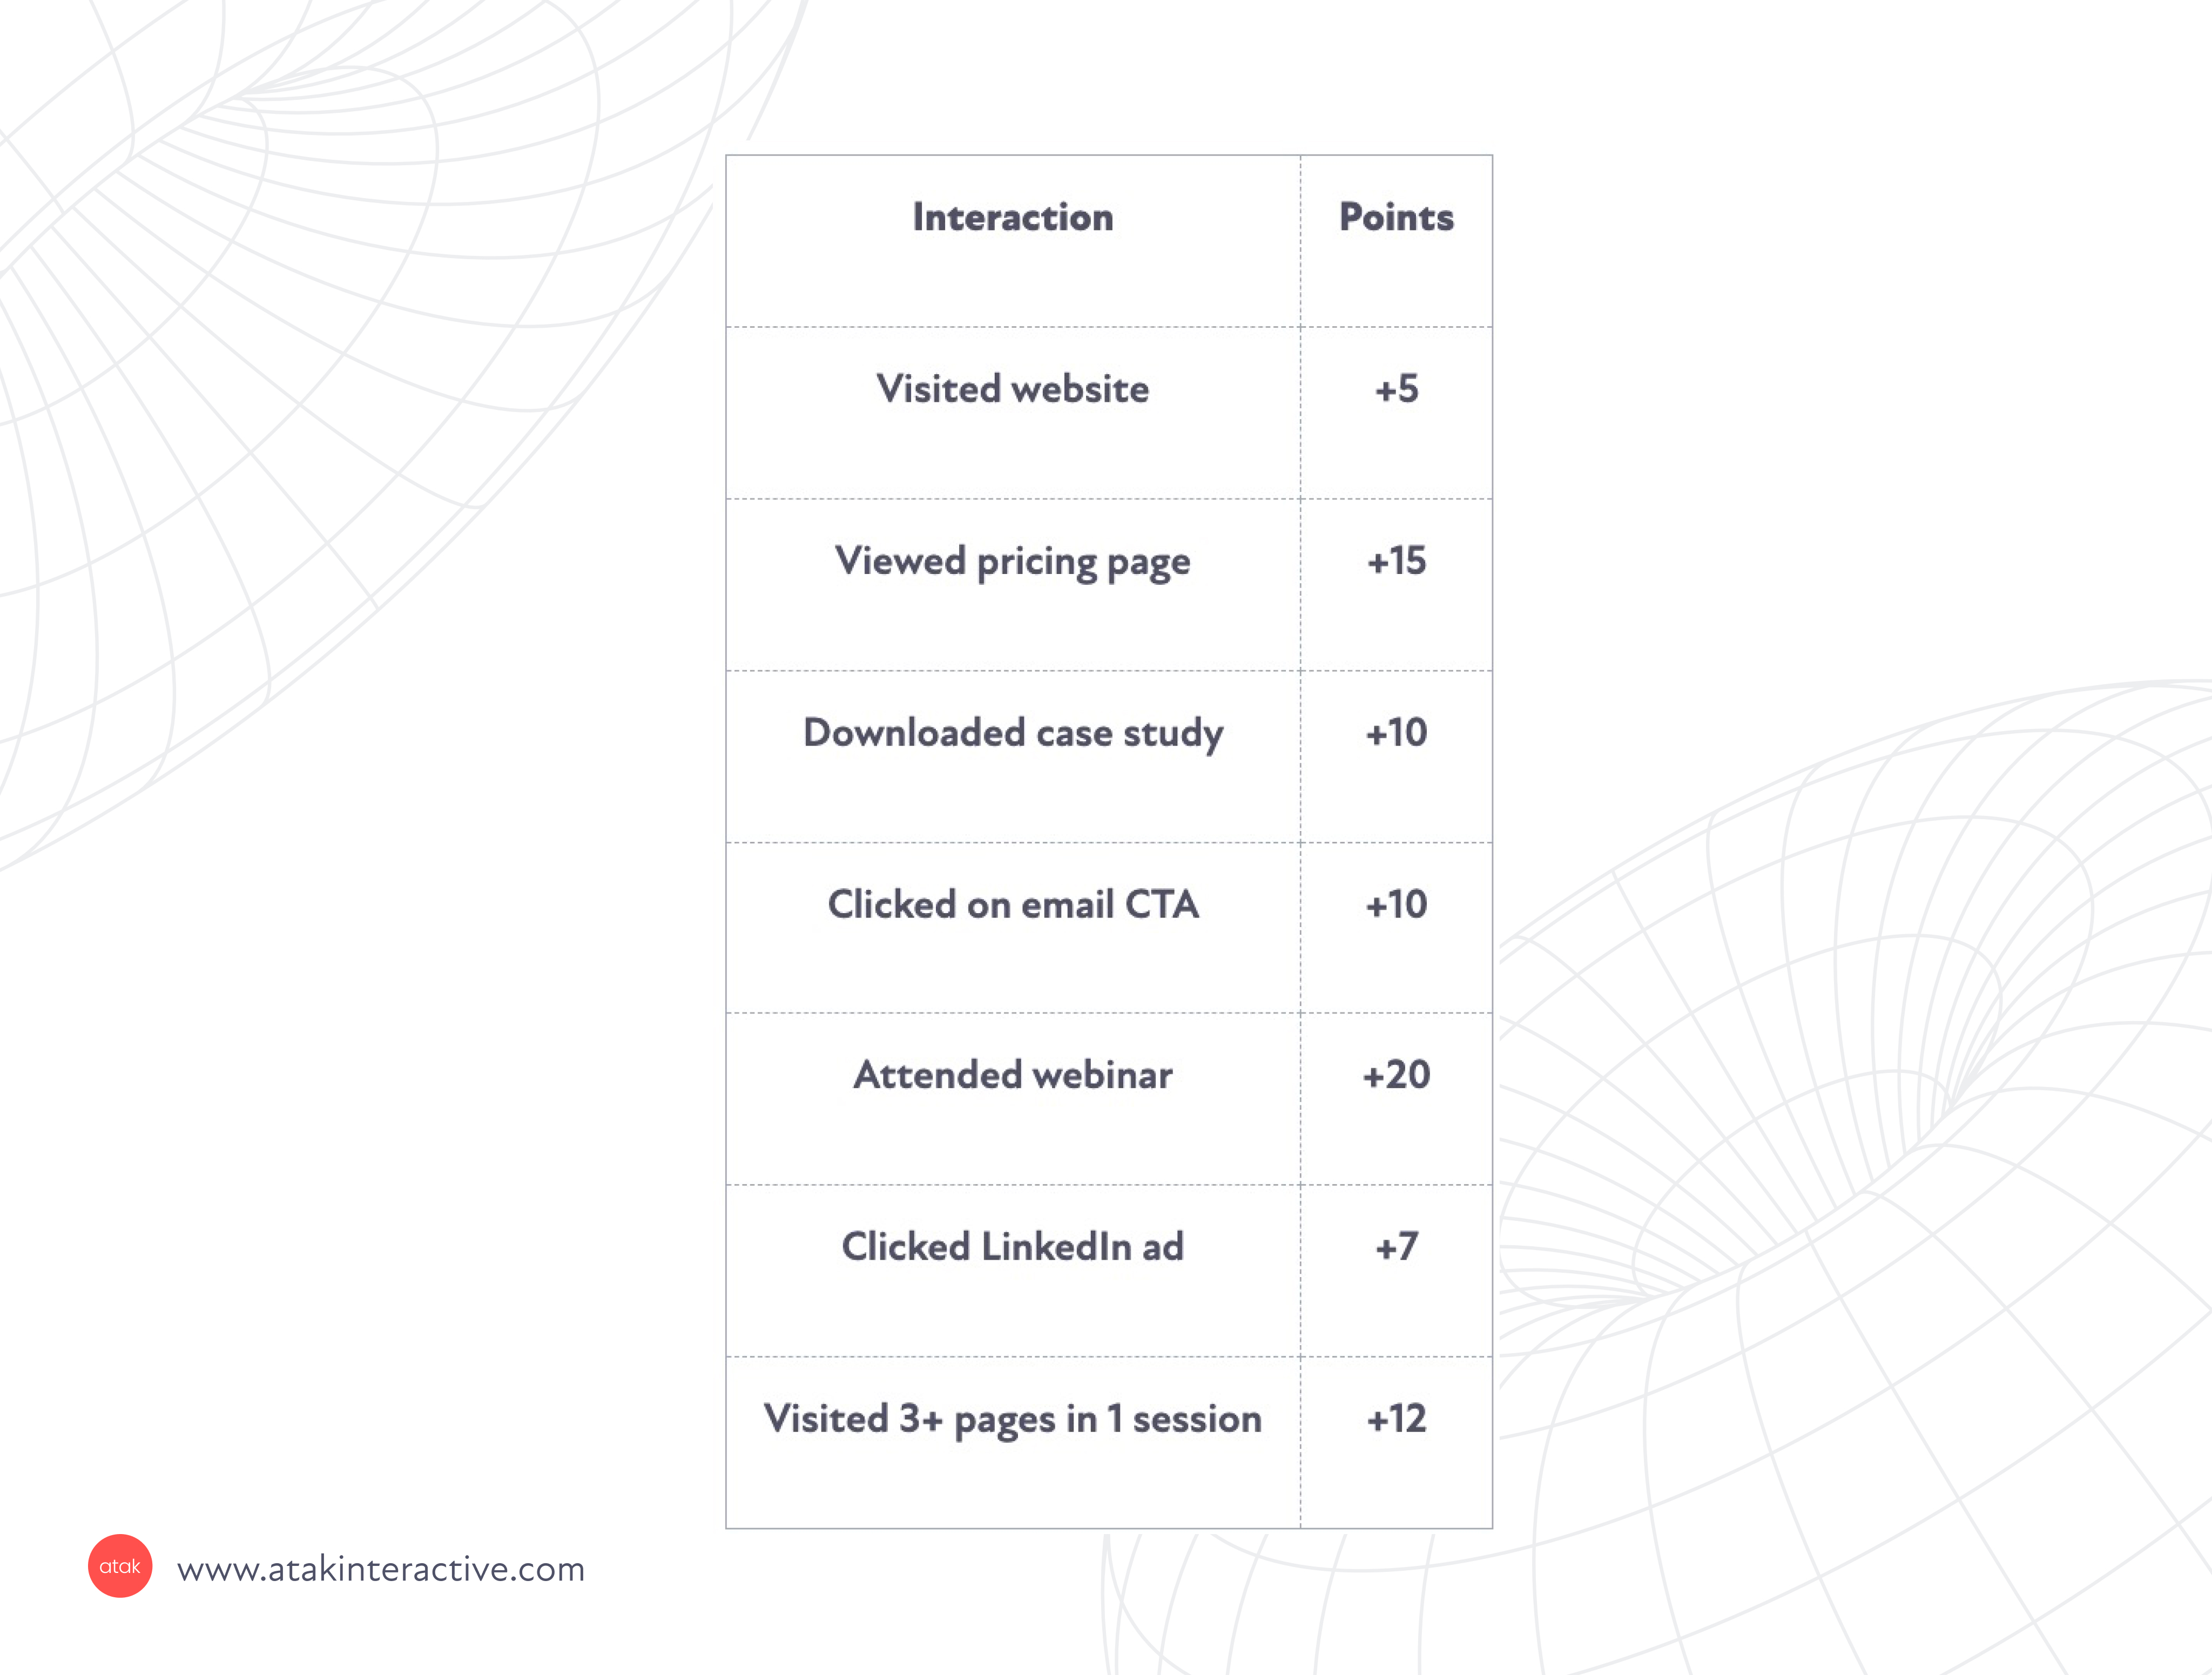
Add it all up per account → That’s your Account Engagement Score. You can bucket accounts as:
- Cold (0–25 pts)
- Warming (26–50 pts)
- Hot (51+ pts)
How many people within that account (decision makers, influencers) have interacted? The more people that interacted, the warmer the lead.
3. Content / Asset Consumption by Account
Which assets (case studies, white papers, ROI calculators) are being consumed? This pinpoints high interest areas.
4. Social / Ad Engagement from Target Accounts
How many folks from target accounts are interacting with your ads, posts, or promos?
Track the following KPIs:
- LinkedIn ad clicks or impressions by account (matched via IP or account lists)
- Retargeting ad CTR (display, video, social)
- Engagement on organic social posts (likes/comments from known contacts)
- % of target accounts reached via ad impressions
Tools like LinkedIn Matched Audiences, Demandbase, RollWorks, or 6sense can surface this data.
Journey & Pipeline Metrics — How accounts move through your ABM funnel
Once your target accounts start engaging, the next question is: are they moving through the funnel? These ABM metrics help you track whether the accounts you're investing in are progressing and converting into real revenue.
1. Account progression rate
Shows how many of your target accounts are moving from one stage to the next: engaged → meeting → qualified → opportunity → closed. This is the momentum check.
KPIs to track:
- % of Tier 1 accounts that booked meetings
- % that became qualified opportunities
- % that entered the pipeline
2. Buying Committee Coverage
Tracks how many key people (Champion, Decision Maker, Technical, Procurement) you’ve engaged inside each account. More roles = higher close rates.
KPIs to track:
- # of engaged contacts per account
- % of opportunities with 3+ roles involved
- Role-specific coverage rates (e.g., how many Decision Makers reached?)
3. Pipeline Velocity (Time to Close)
Measures how fast ABM accounts move from first engagement to closed-won. A shorter cycle shows that you're targeting the right people and warming them up effectively.
KPIs to track:
- Average days from engagement → opportunity
- Average days from opportunity → close
- Total time from first touch → deal won (by tier)
4. Win Rate of ABM Opportunities
Tells you what percentage of ABM deals actually close. A strong win rate proves your targeting and plays are working.
KPIs to track:
- % of ABM opps that result in closed-won
- Win rate by tier (T1 vs T2)
- Win rate for opps with 3+ roles vs 1–2
5. Average Deal Size (ACV)
Shows the revenue per ABM deal. Good ABM should lead to bigger, more strategic deals, especially with Tier 1 accounts.
KPIs to track:
- Average deal value from ABM-sourced deals
- ACV comparison: ABM vs non-ABM deals
- Average expansion value (if upsells are part of your strategy)
Attribution & Revenue Metrics– Did all that ABM effort turn into real revenue?
1. Revenue from ABM Accounts
Track how much revenue came from the accounts you targeted with ABM. You can also measure influenced revenue: deals where ABM played a part, even if it wasn’t the final touch. Track:
- Closed-won revenue from ABM account list
- % of pipeline or revenue influenced by ABM
2. Return on Investment (ROI)
This is the bottom line. Take the revenue from ABM accounts and subtract your total ABM costs (tools, ads, content, people). Then divide by the cost.
Ex: ABM Revenue = $500,000, ABM Costs (ads, content, tech, headcount) = $100,000, then: (500,000 – 100,000) ÷ 100,000 = 4 → 400% Account-Based Marketing ROI
KPIs to track:
- Total ABM program cost
- ABM-attributed revenue
- ROI % by program or campaign
3. Retention and Expansion
ABM doesn’t stop after the first deal. You should track how well you keep and grow your ABM accounts through renewals, upsells, or cross-sells. Track:
- Renewal rate of ABM customers
- Expansion revenue (upsells/cross-sells)
- Churn rate (accounts lost)
4. Customer Lifetime Value (CLV/LTV)
This tells you how much total revenue an ABM customer brings in over time. If your ABM accounts have higher LTV, it shows the strategy is paying off long-term. Track:
- LTV per ABM account
- LTV compared to CAC (customer acquisition cost)
- % of revenue from long-term ABM customers
So... Which ABM Metrics Matter Most?
You don’t need 30 dashboards or a complicated attribution model to prove your ABM strategy is working. You just need to track the right stuff:
- Are your target accounts engaging?
- Are they moving through your funnel?
- Are they converting—and expanding—into real revenue?
That’s it.
When you focus on Account Engagement, Pipeline Progression, and Revenue Impact, you get a complete picture of how ABM is (or isn’t) working. You’ll spot weak points fast. You’ll prove ROI. And you’ll have the data you need to prioritize what’s actually moving the needle.
TL;DR Cheat Sheet:
In order to confidently track ABM success, pay attention to:
✔️ Engagement Metrics: Who's engaging, how often, and across how many roles?
✔️ Journey Metrics: Are accounts converting? Are they moving fast? Are you reaching buying committees?
✔️ Revenue Metrics: What deals closed? What was the ROI? Did customers expand or churn?
Final Takeaways
ABM is about working smarter, not harder. When you focus on the right accounts (and the right metrics), you’re already most of the way there.
Measure what matters, and suddenly it’s not “Is this working?”, it becomes: “This is working. And it’s repeatable, scalable, and driving real growth.”
That’s something we hear from clients all the time at ATAK.
If you’re ready to get clear on your ABM performance or turn insights into action, we’re here to help.
Book a Strategy Call with ATAK


